Truck Load Distribution Analysis Guide
How Better Load Distribution Increases Payload, Safety, and Quality
A truck can look full enough and still leave money behind. See how poor load placement hurts fill factor, wear, and operator consistency.
Article Summary
A truck can look full and still leak efficiency.
This truck load distribution analysis guide explains how poor load distribution quietly reduces fill factor, increases variation, and weakens operator coaching. It shows how 3D load profiles make those hidden patterns visible enough to fix.
-
Total payload can fool you.
A truck can hit a decent number while still being off-center, front-heavy, or underfilled in usable tray space.
-
Small loading patterns create real drag.
Lower fill factor means more trips, more cycle exposure, and more wear quietly building into the operation.
-
Visual proof improves coaching.
3D load profiles turn guesswork into evidence for training, accountability, and continuous improvement.
The hidden loss
Most mines assume the problem is payload.
Sometimes they’re right.
But very often, the more expensive problem is hiding one layer deeper:
the truck is loaded… but it isn’t loaded well.
It looks full enough.
It leaves on time.
Nobody sounds the alarm.
And yet the site keeps paying for the same quiet mess over and over again:
- Tray space left unused
- Loads drifting off-center
- Material stacked too far forward or too far back
- Spill-prone edges
- More variation between operators than anyone wants to admit
That is the trouble with poor load distribution.
It does not announce itself like a dramatic failure.
It hides inside routine.
It gets mistaken for normal.
And while everyone is busy calling it good enough, it quietly chips away at fill factor, consistency, and haul efficiency.
Cost visibility
Truck Load Distribution Analysis: How Low Truck Fill Factor and Payload Distribution Quietly Drain Haul Efficiency
“Looks full enough” is one of those phrases that sounds harmless until you start tracing what it actually means.
- It means the operation may be accepting unused tray volume without noticing.
- It means inconsistent loading can masquerade as business as usual.
- It means supervisors may be coaching from instinct instead of evidence.
- It means payload quality is being judged by eyeballing instead of proof.
And that is where the money leaks out.
A truck can be loaded without being loaded well.
That is not a small problem.
That is a BIG chain reaction.
Illustrative model
Lower fill factor means more trips
Tray utilization vs. trip load
Cause-and-effect chain
Illustrative annual loss model
How a marginal load-efficiency gap can quietly snowball into six figures over a year
Truck Load Distribution Analysis Patterns
Load distribution problems show up in four specific patterns. None of them are visible with traditional measurements.

Off-Center Loading
When an operator drops the load too far left or right, it can wear out the truck. It hurts your operation later.

Front/Rear Bias
When an operator stacks material too far forward or rearward, it hits performance.

Underfilling
The load appears full. Operators stay conservative, the site accepts it, and the operation misses out on gains over time.

Edge Buildup
When operators build material too aggressively near the tray edges, the load gets messier and spill risk goes up.
Capacity reference
That underfilling issue matters because articulated haul trucks are commonly rated by both struck capacity and heaped (SAE 2:1) capacity, meaning a truck can look acceptably loaded while still leaving usable volume behind on every haul.
That’s the difference between coaching by instinct and coaching by evidence.
A better process
How to fix this without starting a civil war in the loader cab Improving load distribution doesn’t require theater. It requires a better process.

Trend monitoring
Step 5Track the patterns over time
Watch trends by operator, shift, loader, truck model, material source, and route or destination.
The goal is not to react once. The goal is to see the pattern early, keep it visible, and stop it from becoming normal.
Operational payoff
What better load distribution actually improves
Every truck leaves with more in it
When load placement is consistently right, fill factor goes up — not because operators are working harder, but because the tray is actually being used.
The same good load, every shift
The goal was never one great load. It was the same load, reliably, regardless of who’s in the cab or what time of day it is.
Coaching that sticks
When a supervisor can show an operator exactly what happened — not describe it, show it — the conversation is shorter, cleaner, and more likely to change behavior.
Fewer spills. Less cleanup.
Less exposure. A load that’s properly shaped and balanced doesn’t fight the haul. It just moves.
The underloading that nobody was catching gets caught
Once you can see load distribution clearly, the trucks that looked fine but weren’t stop slipping through. Capacity stops bleeding quietly into every cycle.
Knowing how to identify poor loading practices is important.
But doing it consistently is where most sites hit a wall.
That’s exactly what the right technology makes possible.
The WingScan answer
How WingScan Technology Gives You Perfect Payloads So You Can Get More From Your Operation
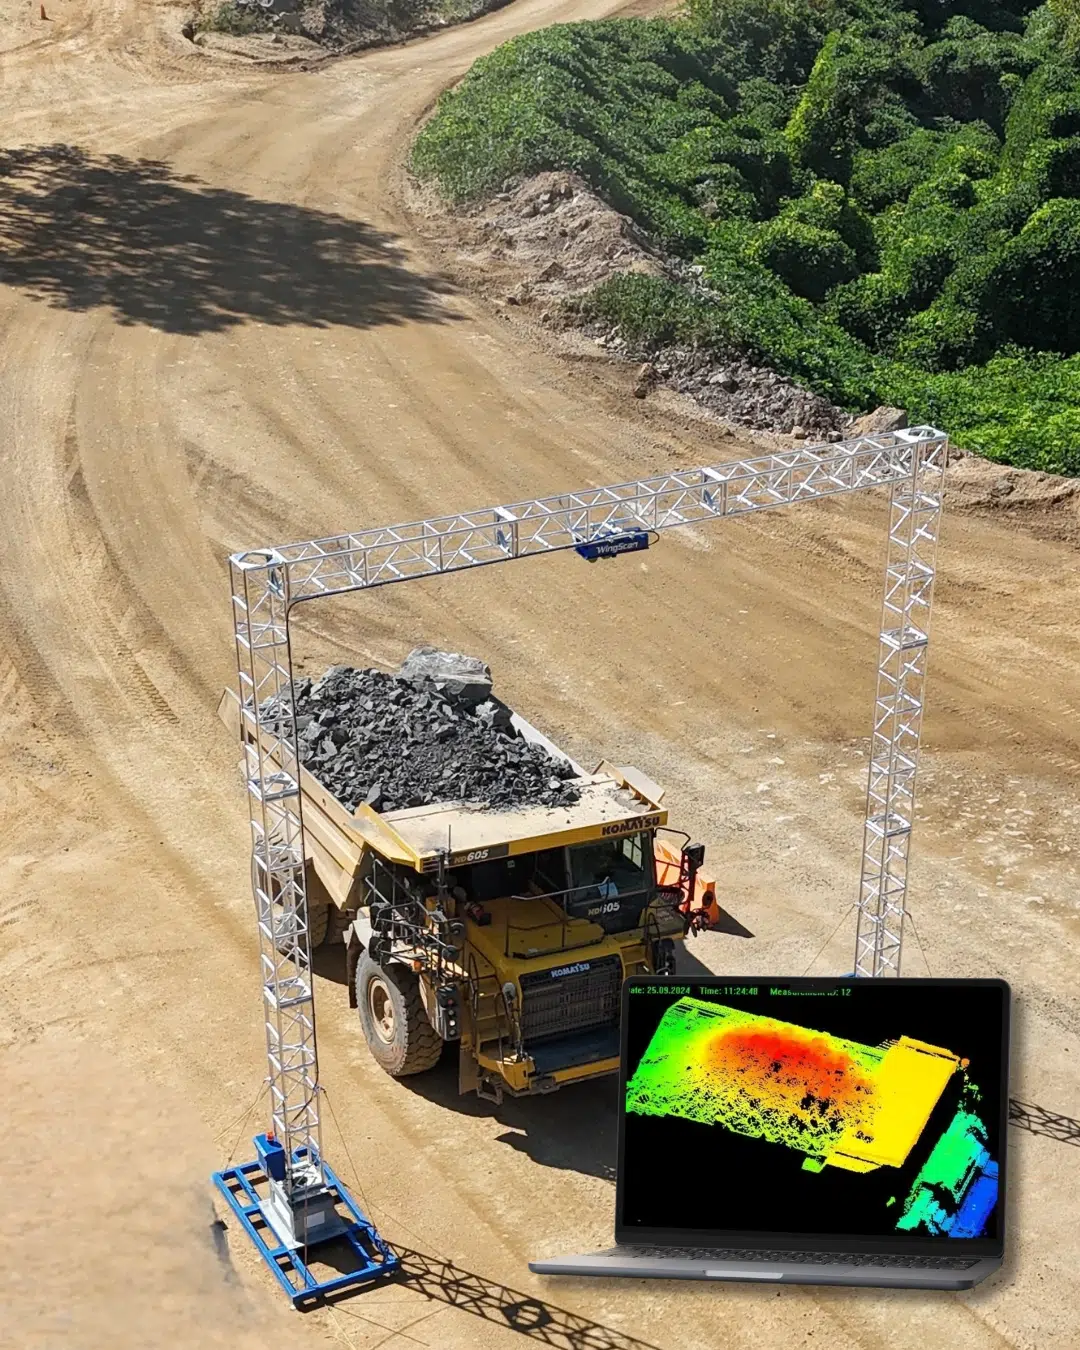
WingScan shows you the load shape, placement, and quality while your haul truck is still in motion.
The WingScan answer
How WingScan Technology Gives You Perfect Payloads So You Can Get More From Your Operation
WingScan shows you the load shape, placement, and quality while your haul truck is still in motion.
It gives your site managers the visibility to manage loading behavior with evidence instead of instinct.
If you can see your material, then you can manage it.
Manager-level visibility
- Improve loading behavior
- Spot repeated underfilling/overfilling
- See and document patterns
- Reduce guesswork, save time
- Increase productivity
- Elevate team morale
Plant managers already work way too hard to waste time eyeballing loads, fixing inventory problems, or chasing issues that technology can solve.
“What makes this volumetric scanning technology reliable?”
We can’t speak to other products, but when it comes to WingScan, the facts speak for themselves.
Leading plants across North America use WingScan to optimize their sites.
They trust WingScan for truck, belt, and rail measurements every day — with experience built across millions of real industrial scans.


Solution-focused proof from real customers


In another instance, I asked Wingfield to come out and service a small lab scale that was not functioning properly. They were prompt in their response and were able to repair the scale. I would highly recommend Wingfield Scale.
Besides being widely used across North America for Truck Load Optimization, our truck load scanner is also Legal-For-Trade.
This means WingScan can be used for commercial transactions because its accuracy is repeatable, verifiable, and tested under standards-driven requirements.

Legal-For-Trade
NTEP approved for commercial transaction.
Repeatable
Built to deliver consistent performance over time.
Verified Accuracy
Part of ongoing conversations at NCWM
Reliable production data helps build a successful operation.
WingScan lets you see your material in real-time (without maintenance, excessive calibrations, or guesswork).
Helpful answers
Frequently Asked Questions About Truck Load Distribution Analysis
What is truck load distribution analysis?
Truck load distribution analysis looks at how material is positioned inside the truck body. It allows you to prevent poor loading patterns that waste your material or wear out your equipment.
Why measure truck loads with volume instead of weight?
Truck scales have their uses; we have the largest truck scale fleet in the weighing industry and provide scales across the United States where applicable.
That said, we also know their limitations.
A volume scanner like WingScan can provide insight beyond density (while still giving you density).
View the truck scale vs. volumetric load scanner comparison chart.
Why does load distribution matter if the payload looks acceptable?
A truck can hit an “acceptable looking” payload total and still be loaded poorly. In mining operations, that problem often shows up as underloading that quietly leaves usable capacity behind on every haul, which can reduce productivity, increase trips, and raise operating costs over time.
Ultimately, you want a repeatably accurate loading system that prevents your loss and enhances your profitability. That’s very hard, if not impossible, to achieve just through eyeballing it; you’d need more than a million little eyeballs with perfect 20/20 vision. They’d also need to function without ever getting any sleep or rest. While a human can’t achieve this, WingScan can.
What is fill factor in haul truck loading?
Fill factor refers to how much of the truck body’s available carrying volume is actually being used. If you utilize your trucks’ trays better, you can significantly cut operating costs over time.
What causes poor truck load distribution?
Poor truck load distribution usually comes from inconsistent bucket placement, changing material behavior, operator variation, carry-back, fragmentation changes, density shifts, route conditions, and loading habits that are hard to see without a visual load profile.
How does truck load distribution affect fill factor?
Truck load distribution affects fill factor because the truck body can look acceptably loaded while still leaving usable tray volume open. Better placement helps the truck carry more usable material per cycle without relying on guesswork.
How can operations improve haul truck load distribution?
Define what a good load looks like, review early-shift loading patterns, coach with visual proof, separate placement problems from material problems, and track repeat patterns over time. Implement smart technology like WingScan to automate the process of load distribution optimization.
How does a 3D load profile help?
A 3D load profile makes load shape visible. It reveals off-center bias, front-to-rear imbalance, unused tray volume, and spill-prone edge buildup that may not be obvious from a total payload number alone.
In short, more visibility means better production management.
Free resource
Stop Guessing at Payload Quality. Start Managing It.
Operators miss poor load distribution when all they see is a payload total through weight-only measurements. But once you can see load shape, placement, fill factor, and repeat patterns, you can manage production more easily. It means you can begin standardizing loads to maximize profitability while minimizing loss.
Download the truck load distribution guide to explore further, or talk with WingScan about what better payload visibility could look like at your operation.
.png)