Bulk density measurement
A bulk density measurement tells you the mass of material per unit of bulk volume, including the spaces between particles.
Bulk density formula: quick answer
Formula: bulk density = mass ÷ bulk volume.
Example: 100 lb ÷ 1 ft³ = 100 lb/ft³.
Measurement check: use mass and volume from the same sample.
But here’s what a tonnage total can hide: two loads can weigh the same and take up different amounts of space. See how volume and density together can help you check your material totals.
Use the bulk density calculatorCalculation and method
Bulk density calculator
Calculate bulk density
Bulk density = mass ÷ bulk volume
Use independently measured net material mass, excluding the container or vehicle. Match it to the bulk volume of the same material, and state whether the mass is wet or dry.
A U.S. short ton is 2,000 lb; a gross or long ton is 2,240 lb; a metric ton is 1,000 kg. See the NIST unit conversion tables.
See a worked bulk density calculation
Bulk density calculation: U.S. and metric examples
47 U.S. short tons × 2,000 lb per short ton = 94,000 lb. Divide by 1,000 ft³ to get a bulk density of 94 lb/ft³.
In metric units, 150 metric tons ÷ 100 m³ = 1.50 t/m³.

How to measure bulk density from a sample
Take a representative sample from the point in your operation you want to check. Use a container with a known internal volume.
- Weigh the empty container.
- Fill it to the known volume, keeping filling and packing conditions consistent between samples.
- Weigh the filled container and subtract the empty container’s mass.
- Divide that net mass by the occupied bulk volume.
A 1 ft³ container weighing 10 lb empty and 110 lb filled contains 100 lb of material, giving a bulk density of 100 lb/ft³.
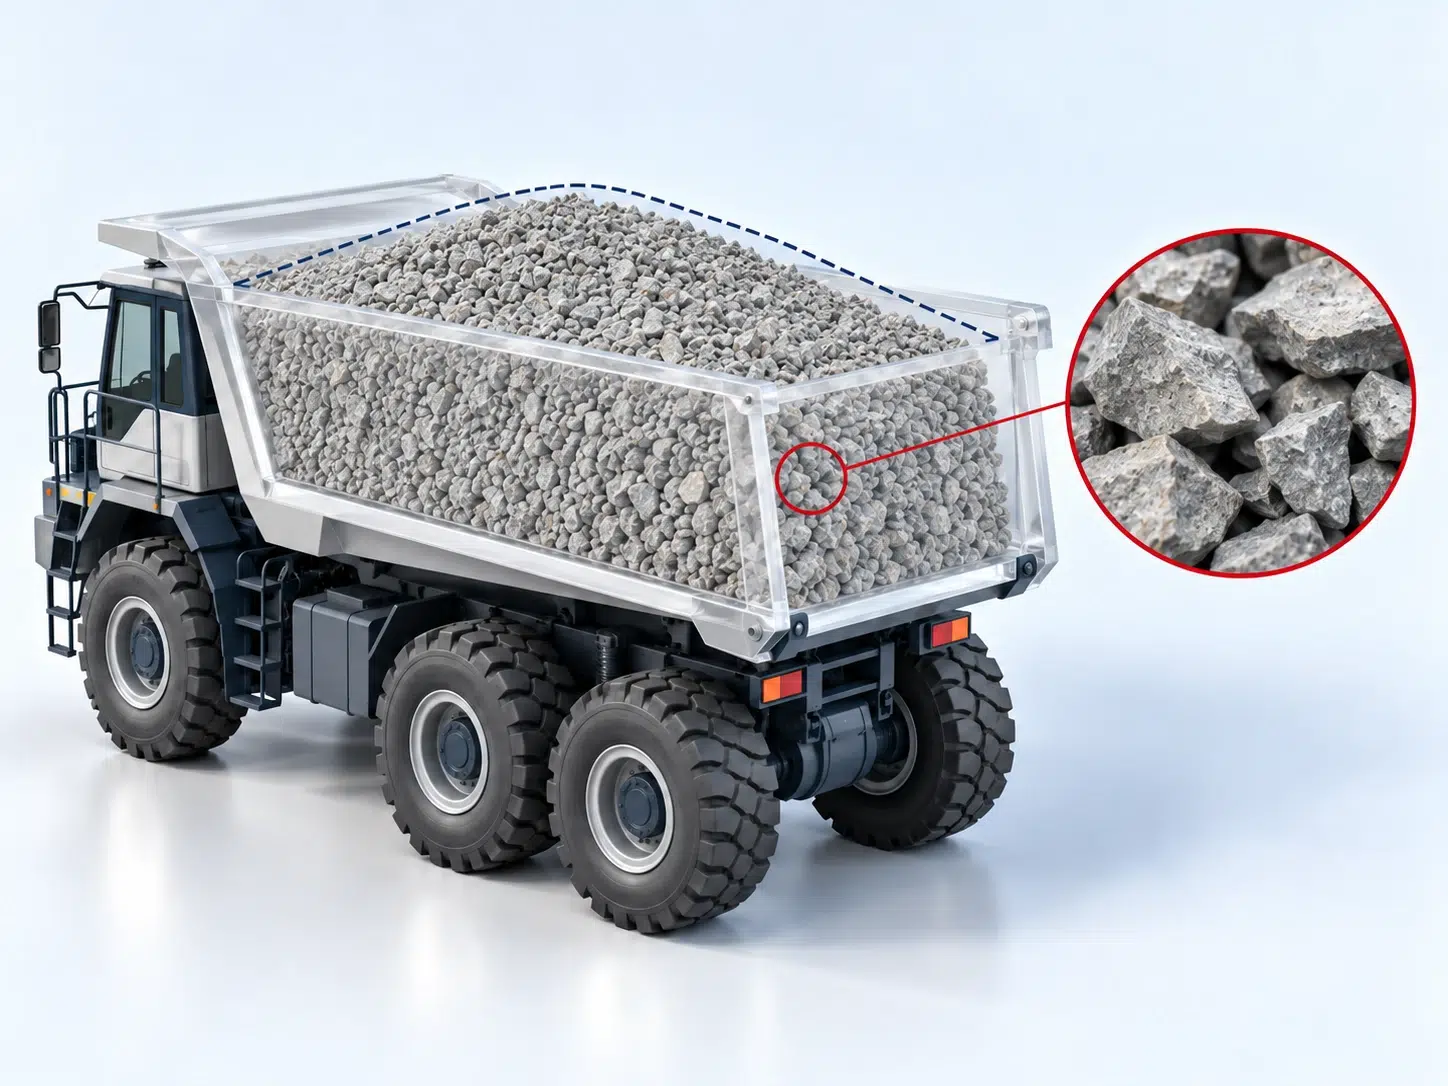
Loose bulk density is measured without deliberately compacting the material. Compacted or tapped bulk density uses a specified compaction or tapping method. Compare samples measured the same way, and label each result as wet or dry. Packing, particle size, material mix and moisture can change bulk density.
For aggregates, follow ASTM C29/C29M’s bulk density and voids method. Particle density measures the solid particles alone, excluding the spaces between them.
Compare published reference densities
Use your lab or production density where it represents your material. The KWS bulk material table lists published reference values for comparison:
| Material and condition | Bulk density (lb/ft³) |
|---|---|
| Portland cement | 94 |
| Aerated Portland cement | 60–75 |
| Dry aluminum chips | 7–15 |
The example uses 47 U.S. short tons and 1,000 ft³, giving 94 lb/ft³. Use your material’s measured mass and matching volume, as Kase’s material guidance recommends.
Understanding your material totals
What your tonnage total can’t show
That sample gives you a density value. In our work with hundreds of bulk material operations across North America, we use volume and density together to check material totals.
A weight reading tells you mass. A volume record tells you how much space the material occupies. With both, you can check bulk density and investigate unexplained inventory differences, inconsistent feed or a disputed delivery.
Our WingScan volumetric load scanners measure volume directly on conveyors, in trucks and in railcars. When you need tons, we convert that volume using a density that represents your material.

100 lb1 ft³ occupied bulk volume
100 lb ÷ 1 ft³ = 100 lb/ft³
100 lb2 ft³ occupied bulk volume
100 lb ÷ 2 ft³ = 50 lb/ft³
When water weight changes your material total
Besides changes in material mix or packing, added water can change your tonnage total. A wet-weight total includes dry solids and water. Hold the same wet-feed target as moisture rises, and you deliver less dry material.
WingScan measures volume independently of water weight. Where moisture changes wet mass more than bulk volume, volume can give you a steadier feed signal.
Check your material’s volume response: moisture can change packing, swelling or clumping.
Converting volume to dry-material mass needs a representative dry-basis bulk density. Correcting wet mass needs a validated moisture measurement.
For aggregates, the American Concrete Institute explains how to measure surface moisture.
Water weight and the cost of a material shortfall
You can also quantify the dry-material shortfall from a moisture change.
See an illustrated water-weight example
More water can mean more wet weight for the same solids
Compare two illustrative batches of 100 metric tons of dry solids carrying 10 and 20 metric tons of water. Assume each occupies 100 m³.

| Quantity | Batch A | Batch B |
|---|---|---|
| Dry solids | 100 t | 100 t |
| Water | 10 t | 20 t |
| Wet mass | 110 t | 120 t |
| Assumed bulk volume | 100 m³ | 100 m³ |
| Wet bulk density | 1.10 t/m³ | 1.20 t/m³ |
Wet mass rises from 110 to 120 metric tons, an increase of 9.1%. Counting all 120 as dry material would put 20 metric tons of water in your material account.
At a dry-basis bulk density of 1.00 t/m³ in this assumed case, either volume total represents 100 metric tons of dry solids.
Published material-price references
The USGS Mineral Commodity Summaries 2026 gives the following 2025 estimates. We’ve converted dollars per metric ton to dollars per U.S. short ton using the NIST conversion factor.
| Material | USD / short ton | Published basis |
|---|---|---|
| Construction sand and gravel | $13.15 | Average unit value |
| Crushed stone | $16.78 | Average unit value |
| Industrial sand and gravel | $32.66 | Average across industrial uses |
| Cement | $145.15 | Average mill unit value |
| No. 1 heavy melting steel scrap | $289.39 | Average delivered composite |
Grade and condition can make a large difference. For a separate local example, LMS Metal Buyers’ posted price list, effective July 10, 2026 and checked October 24, lists clean, dry aluminum cans at $0.80/lb. That’s $1,600 per U.S. short ton of that accepted material. Use your own current price for the grade and condition you handle.
For frac sand, use your product’s contract or accounting value; the industrial-sand average above covers several uses. Match delivery terms and moisture basis too.
Calculated quantities and unit prices show up to six significant figures. Total costs are rounded to cents.
For a full belt-measurement investment comparison, use our separate WingScan-B belt load scanner ROI calculator with your calibration, maintenance and production-loss figures.
Software and field evidence
Track volume and density together in your software
For an ongoing check, our WingScan software lets you review entered density values alongside measured volume over time.
See which density was used for a batch or reporting period, and whether a change in calculated tonnage came from volume, density, or both.
Check the density behind your tonnage
If you also have an independently measured net weight for the same material, divide it by scanned volume to check bulk density. Compare that result with the density used for your conversion. This can help you catch a density value that no longer represents your material.
If your lab already collects density samples, put those records to work. Review the value when your material mix, packing or moisture changes, and keep its units, source and date with your volume record.

View full-size screen

“Gypsum moisture changes a lot, but volume doesn’t change as much as mass does with moisture.”
Walt Weninegar · Heidelberg Materials
Cement plant case study
See how volume and density worked together at Leeds.
At Heidelberg Materials’ Leeds plant, synthetic-gypsum volume stayed comparatively stable through large moisture changes. The team used sampled dry-basis densities with volumetric control and reported less variation in cement SO₃.
- Use sampled density values for conversion.
- Track volume alongside production records.
- See clumps and gaps that expose uneven feed.
Choose WingScan for your material flow
Those records become more useful when you can see the material behind them. WingScan pairs volume data with views of the loads moving through your operation.
Truck loads: WingScan-T
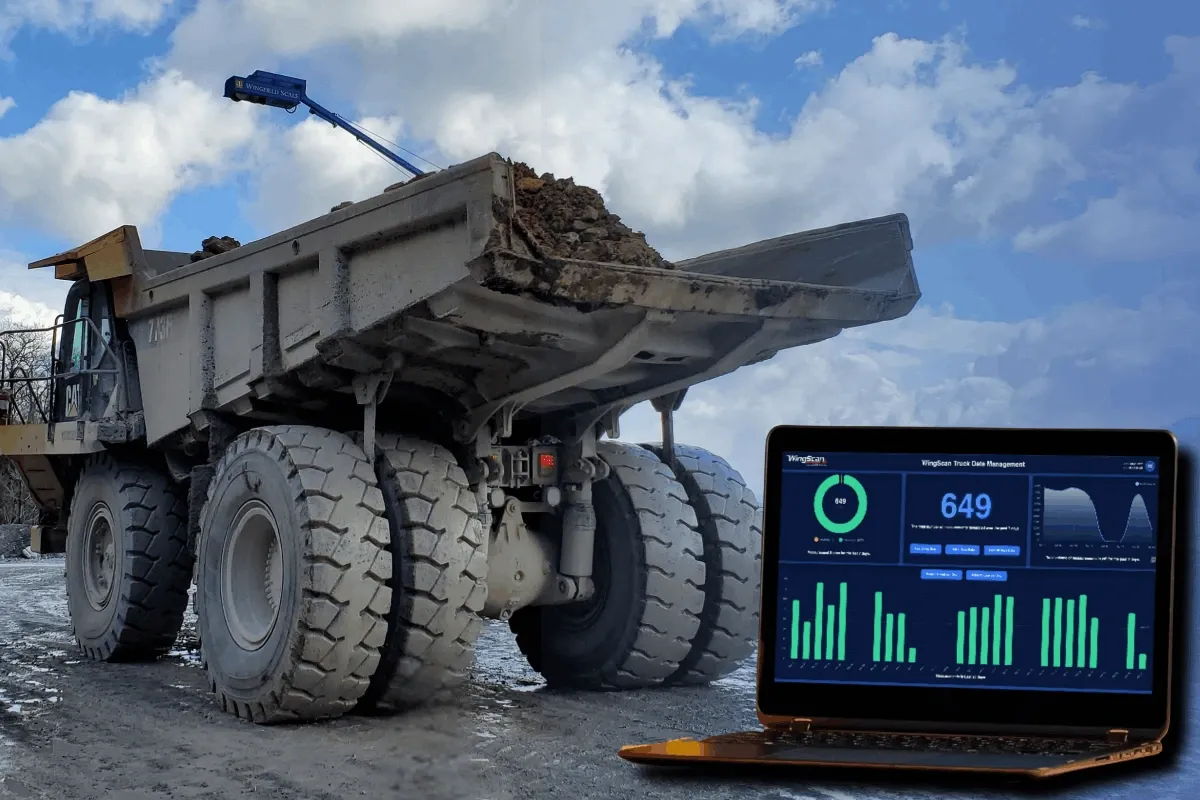
Compare truckload volumes and inspect each load’s three-dimensional profile to investigate underfilling, overfilling or carryback after unloading.
Railcar loads: WingScan-R
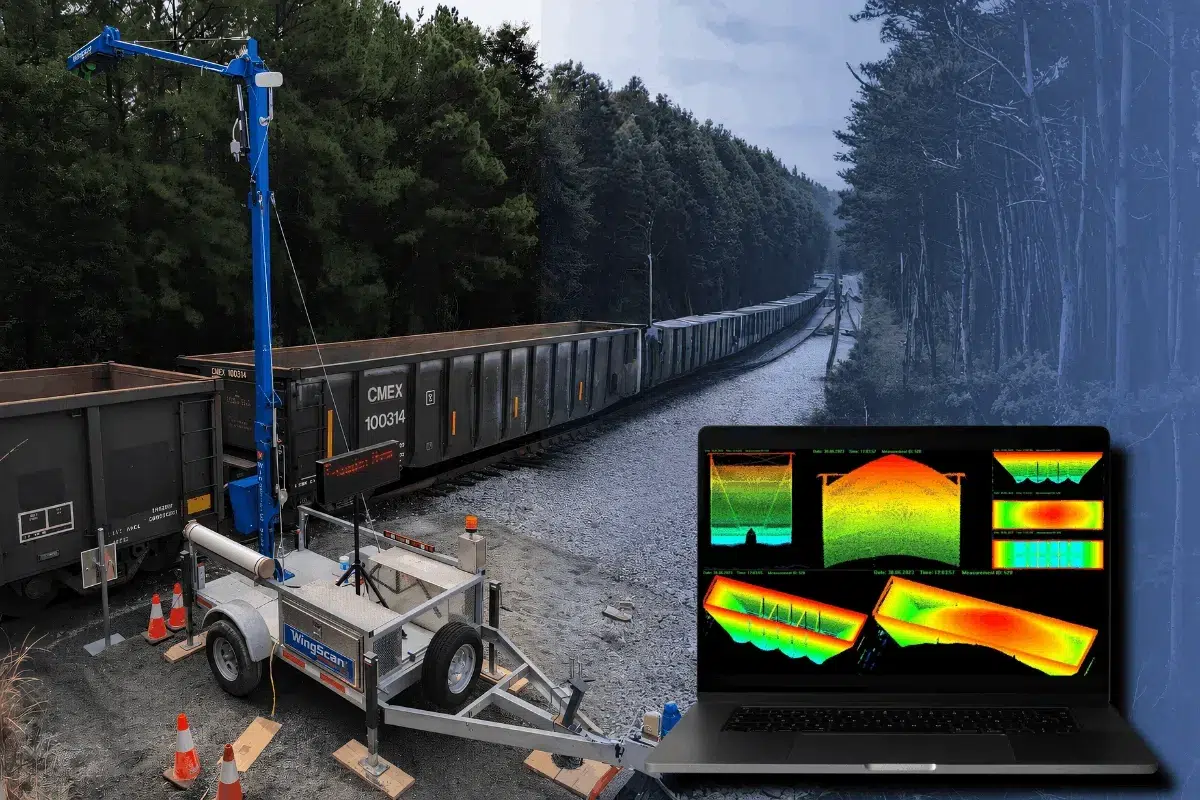
Measure individual railcar volumes and review load profiles. Match inbound and outbound volumes to the corresponding RFID-tagged car records.
See material flow and load distribution
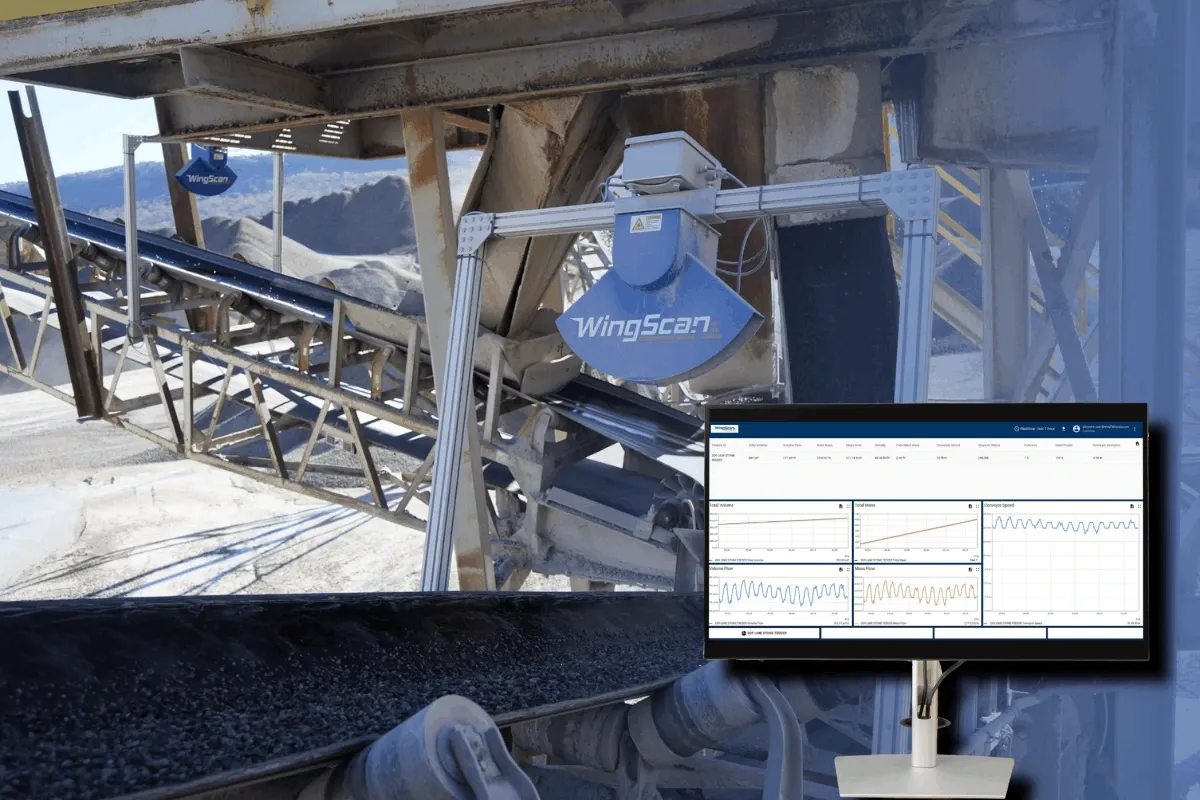
On conveyors, WingScan-B compares the loaded profile with an empty-belt reference. It combines the cross-sectional area with belt speed to calculate volume flow, which the software totals over time.
The 2D cross-section shows material height and distribution across the belt; successive profiles build the 3D surface view. This gives you a way to inspect feed patterns that a mass-flow number alone cannot show.
For the full measurement comparison, see our guide to volumetric scanning and scales.
See a WingScan-B installation

Check your bulk density measurements
Whether you’re checking a sample, a delivery or a production run, keep the comparison consistent:
- Follow the same material, load or time interval. Allow for travel time, transfers and material added or removed between measurement points.
- Match the moisture basis and sample method. Keep wet and dry values clearly labeled.
- Use independently measured net mass to check density. Mass already calculated from volume × entered density cannot verify that same density.
- Check instrument setup, net-mass calculation and, for conveyors, belt zero and belt-speed input.
Put volume data to work in your operation
With those checks in place, let’s look at where volume could give you a clearer picture of your material totals. We’ll work through your material, density records and measurement points with you.